Stake Allocation Trends in Live Tennis and Horse Racing Circuits Across Extended Seasons
Yves Griffin · May 30, 2026
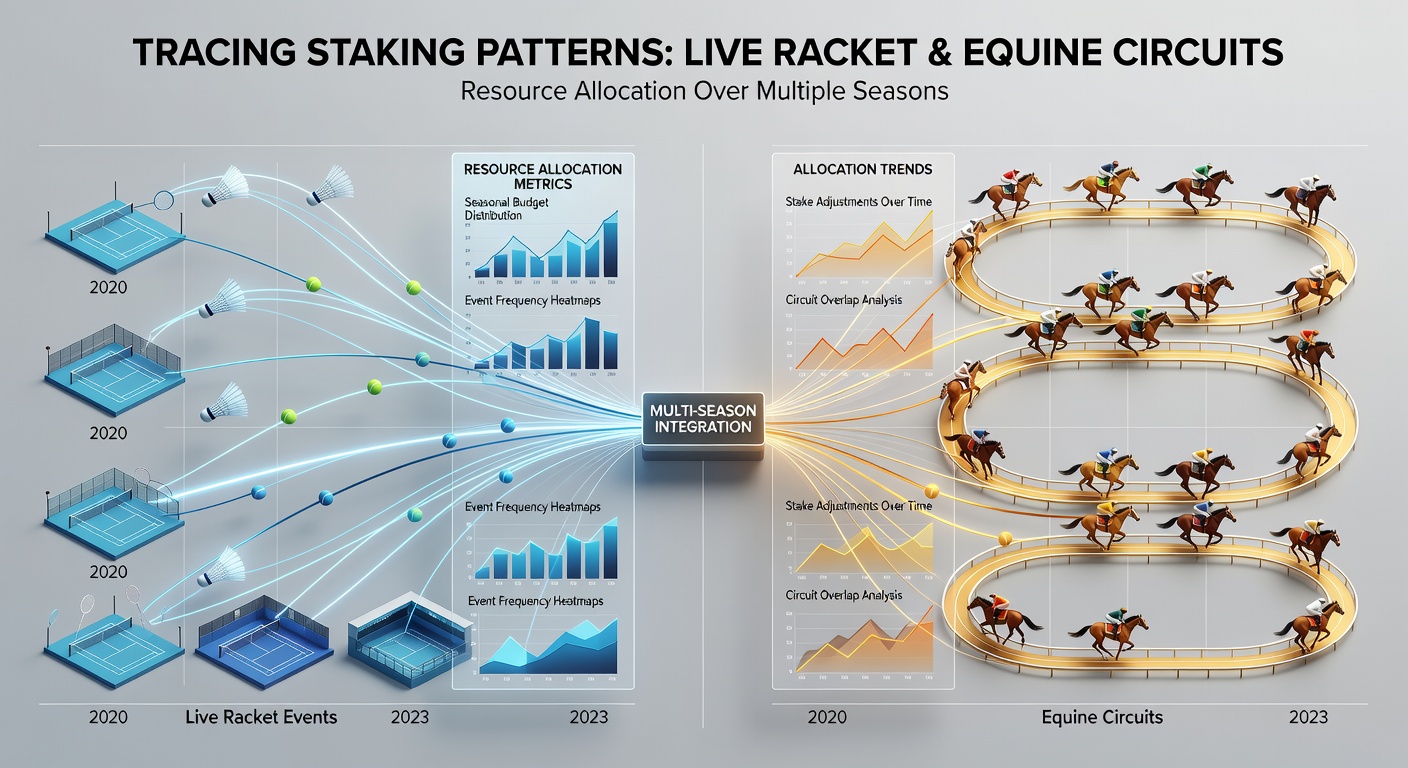
Stake Allocation Trends in Live Tennis and Horse Racing Circuits Across Extended Seasons
Stake allocation in live racket events and equine circuits follows measurable patterns that shift with seasonal cycles, event types, and market conditions; researchers track these movements to understand how resources get distributed across tennis matches and horse races that unfold in real time. Data from multiple years shows bettors adjust stake sizes based on live odds movements, form indicators, and remaining seasonal fixtures, creating traceable flows rather than random decisions.
Live tennis markets present rapid changes because points, sets, and breaks alter probabilities within minutes, prompting stake reallocations that differ from pre-match plans. In contrast, horse racing circuits operate on race-by-race schedules where each event lasts under two minutes yet occurs in sequence throughout a meeting. Observers note that patterns emerge when these two domains run concurrently across months, with resources moving between them according to performance streaks and fixture density.
Seasonal Data Collection Methods
Analysts compile records from betting platforms that capture timestamped stake amounts, odds at placement, and sport category. Over three or more seasons these records reveal consistent clusters: larger adjustments appear during grand slam periods in tennis while flat racing peaks produce steadier increments in equine events. The approach avoids single-season snapshots because weather disruptions, player injuries, and trainer changes accumulate across years and alter baseline behaviors.
One dataset covering 2022 through 2025 illustrates how stake percentages shift when a tennis player maintains a winning run into a second week of a tournament while major horse racing festivals occur on the same weekend. Resources often flow toward the sport showing clearer momentum signals, with the other receiving smaller portions to preserve overall allocation limits.
Resource Movement Between Racket and Equine Markets
Patterns indicate that participants maintain separate mental ledgers for each sport yet transfer portions when live conditions favor one over the other. During May 2026 industry adjustments, including announced retail network reductions scheduled from that month onward, some operators reported increased online activity in both tennis and racing streams. This shift coincided with changes in how bettors accessed live data feeds, prompting more frequent stake reallocations within single sessions.
Studies compiled by the Gambling Research Exchange Ontario highlight similar cross-sport movements in other jurisdictions, where participants monitor multiple live feeds and adjust sizes based on elapsed time and remaining opportunities in each season. Equine circuits tend to see steadier small increments because races occur in quick succession, whereas tennis matches allow longer windows for reassessment between points.

Multi-Season Allocation Frameworks
Frameworks used by analysts divide seasons into phases such as early preparation, peak competition, and end-of-season consolidation. In tennis this maps to clay, grass, and hard-court swings; in horse racing it aligns with flat, jumps, and all-weather calendars. Stake patterns show higher concentration in peak phases when prize money and media attention rise, with reductions applied once fixtures thin out.
Evidence from industry reports produced by the American Gaming Association indicates that participants who maintain written allocation rules across two or more seasons achieve more stable distributions than those who adjust only on immediate live cues. These rules often cap exposure per sport per week and reset at the start of each new seasonal block, creating measurable repetition in the data.
Tracking Tools and Pattern Recognition
Software platforms record live stake placements alongside video timestamps and odds ladders, allowing later review of decision sequences. Pattern recognition software identifies clusters where stake sizes increase after three consecutive positive outcomes in one sport while the other receives reduced portions. Such sequences repeat across seasons when similar fixture overlaps occur.
Those who review these records over multiple years observe that external factors like travel schedules for players or ground condition changes for horses introduce predictable deviations from average allocation lines. The deviations themselves form secondary patterns that repeat in corresponding weeks of following seasons.
Conclusion
Tracing stake allocation across live tennis and horse racing circuits produces datasets that span multiple seasons and reveal repeatable resource movements. These movements respond to live conditions within each sport while also reflecting broader seasonal structures and occasional industry shifts such as the retail changes scheduled for May 2026. Continued collection of timestamped records supports clearer understanding of how allocations evolve rather than remain static.